
To compare the performance of different models, we use evaluation metrics such as
- Accuracy: The percentage of total predictions that were correct. Accuracy is highest when classes are balanced.
- Precision: Of all the emails the model labeled as a certain category, the percentage that were correct.
- Recall: Of all the emails that truly belong to a category, the percentage the model correctly identified.
- F1-score: The harmonic mean of precision and recall. F1 provides a balanced measure of performance, when you care about both false positives and false negatives.
- Support: Indicates how many actual samples there were for each class. Support is helpful in understanding class distribution.
Step 4: Test the classification model and evaluate performance
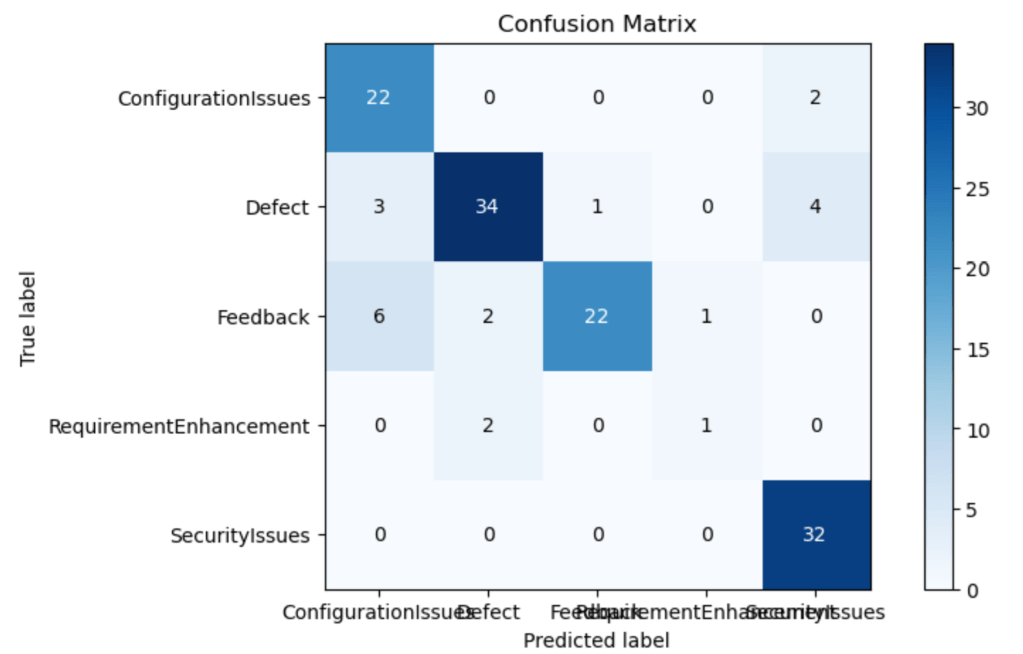
The code listing below combines a number of steps—preprocessing the test data, predicting the target values from the test data, and evaluating the model’s performance by plotting the confusion matrix and computing accuracy, precision, and recall. The confusion matrix compares the model’s predictions with the actual labels. The classification report summarizes the evaluation metrics for each class.
#Reading Test Data
test_df = pd.read_csv(test_Data.txt',delimiter=";",names=['text','label'])
# Applying same transformation as on Train Data
X_test,y_test = test_df.text,test_df.label
#pre-processing of text
test_corpus = text_transformation(X_test)
#convert text data into vectors
testdata = cv.transform(test_corpus)
#predict the target
predictions = clf.predict(testdata)
#evaluating model performance parameters
mlp.rcParams['figure.figsize'] = 10,5
plot_confusion_matrix(y_test,predictions)
print('Accuracy_score: ', accuracy_score(y_test,predictions))
print('Precision_score: ', precision_score(y_test,predictions,average="micro"))
print('Recall_score: ', recall_score(y_test,predictions,average="micro"))
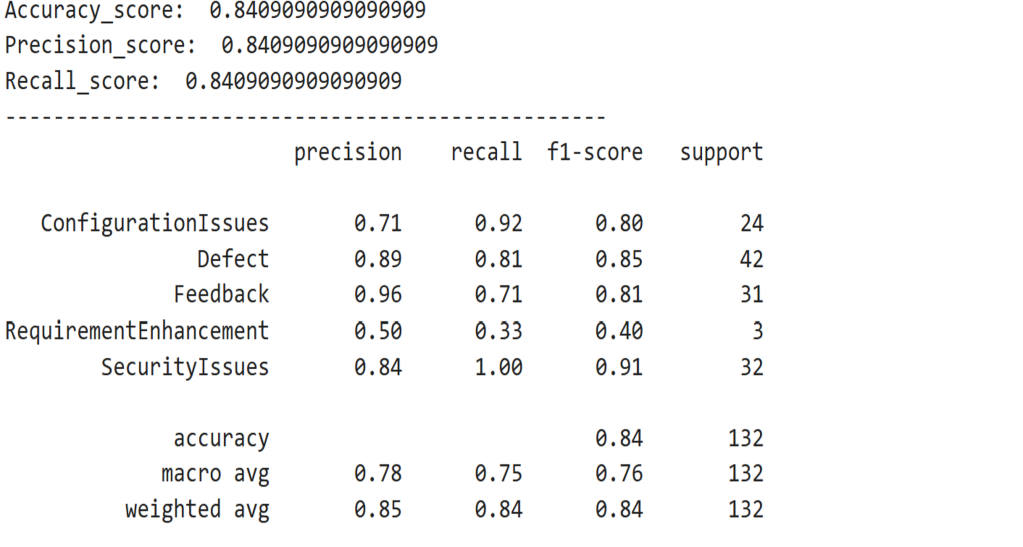
print(classification_report(y_test,predictions))
Output –
IDG
IDG
While acceptable thresholds vary depending on the use case, a macro-average F1-score above 0.80 is generally considered good for multi-class text classification. The model’s F1-score of 0.8409 indicates that the model is performing reliably across all six email categories.

